

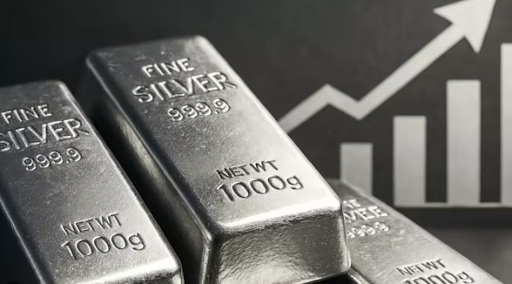
Everything most investors believe about precious metals in wartime broke this year. Silver was supposed to be the safe haven with a supply story — instead it has crashed 52% from its January 29 record of $121.62 to roughly $57.79 on July 30, 2026, per FXStreet data, and it did most of that falling while the US–Iran war was actually being fought. The reason is the single most under-priced fact in this market: 58% of silver demand is industrial, per the Silver Institute’s World Silver Survey 2026. Silver is an industrial cyclical wearing a monetary costume — and when a hawkish Federal Reserve attacks growth expectations, it trades with the factories, not with fear.
That framing is what this silver price prediction gets that the crash commentary misses. The war didn’t fail to lift silver; the war caused the fall, by putting a floor under oil, keeping inflation sticky, and forcing the Fed to cut its 2026 rate-cut projection from two to one. Higher-for-longer rates hit solar panels, semiconductors and EV components — the demand base that was supposed to be silver’s bull case. Meanwhile the gold-silver ratio has blown out to roughly 69:1, near the top of its 50-year range, with gold above $4,050 while silver sits at $58. One metal is priced for fear, the other for recession — and that spread, not the crash itself, is where the opportunity question lives. (This forecast consolidates and supersedes our June 10, June 21, June 30 and July 9 silver calls, whose bull cases were struck off pre-crash prices.)
Key facts
- Silver spot: about $57.79 on July 30, 2026, down 52% from the January 29 record of $121.62 — FXStreet, FXEmpire, July 2026
- Gold-silver ratio: ~69:1, near the top of its 50-year range, with gold above $4,050 — Fortune, July 30, 2026
- 58% of silver demand is industrial (solar, semiconductors, EVs, medical) — Silver Institute World Silver Survey 2026
- 2026 supply deficit: 46.3 million ounces, the sixth consecutive annual shortfall — Metals Focus / Silver Institute, via FXEmpire
- UBS cut its own 2026 deficit estimate ~80%, from ~300Moz to 60–70Moz, citing a 20% photovoltaic demand fall and a 70Moz drop in ETF holdings — Kitco, May 14, 2026
- Street targets after the cuts: JPMorgan $60–65 rest-of-year, Commerzbank ~$67, LBMA consensus $79.57, UBS $80 year-end, Goldman Sachs $85–100, Citigroup $110 — FXEmpire, July 2026
- July 29 FOMC: rates held on a 9–3 vote — all three dissents wanted a hike — per FinanceFeeds’ FOMC coverage
What actually happened: the war trade inverted
Silver’s collapse ran through three distinct legs. The first was positioning: the January melt-up to $121.62 was a crowded momentum trade sitting on top of a genuine 2025 supply-deficit story, and the reversal after January 29 wiped the leveraged length out in days. The second leg was the war itself. When the US–Iran conflict began in February, gold initially did its job while silver did not — because the conflict’s lasting market effect was oil-driven inflation through the Strait of Hormuz, which hardened the Federal Reserve rather than breaking it. The third leg was the June FOMC, where the 2026 dot-plot projection went from two cuts to one; silver broke $60 within days and printed its July 16 low near $55.90.
Here is the mechanism in one sentence: silver’s marginal buyer is a solar manufacturer, a semiconductor fab or an EV supplier, and every one of them is rate-sensitive. Gold’s marginal buyer in 2026 has been a central bank or a fear-driven allocator, which is why gold holds above $4,050 while silver has round-tripped a year of gains. The July 29 FOMC sharpened the divergence rather than resolving it: the committee held rates on a 9–3 vote, and all three dissenters wanted a hike, not a cut — the most hawkish dissent structure of the cycle, as covered in FinanceFeeds’ breakdown of the July decision. Crude has since cooled to around $72, which removes some of the inflation impulse, but the Fed’s reaction function is now the whole silver trade.
“Investor appetite had dried up,” is how Gregory Shearer, head of base and precious metals strategy at JPMorgan, summarised the demand side after the bank cut its rest-of-year band to $60–65 — while naming “silverless solar technology as the largest long-term risk” to the structural story, per FXEmpire.
What the institutions are actually doing
The street’s response has been target cuts almost everywhere — but the dispersion is unusually wide, and that dispersion is the honest state of the market. UBS strategists Wayne Gordon and Dominic Schnider delivered the most consequential revision on May 14, cutting the bank’s 2026 supply-deficit estimate from roughly 300 million ounces to 60–70 million and trimming every forecast horizon: the year-end target went from $85 to $80, September from $95 to $85. “For 2026, we expect weaker demand from photovoltaics due to elevated prices; higher prices are also weighing on silverware and jewelry demand,” they wrote, adding: “Consistent with the smaller deficit, we have trimmed our price outlook across all forecast horizons. In our base case, we expect silver to trade broadly sideways,” per Kitco.
Yet even UBS’s slashed deficit still sits above the official Metals Focus/Silver Institute 2026 shortfall of 46.3 million ounces — the sixth consecutive annual deficit. JPMorgan cut hardest ($60–65). Commerzbank sits near $67. The LBMA consensus is $79.57. Goldman Sachs holds $85–100, and Citigroup still carries a $110 second-half target. Exchange infrastructure is meanwhile leaning into the volatility rather than away from it — Binance launched gold and silver options this week after a futures-volume surge, which tells you the flow being built for is two-way.
The positioning washout shows up on the derivatives side too: COMEX silver open interest has collapsed to levels last seen around the 2016 bear-market bottom, a flush of leveraged speculative length that metals communities flagged in early July, per discussion on r/OccupySilver. Depressed open interest guarantees nothing — but historically it describes a market with fewer weak hands left to sell.
The numbers: what $58 silver is pricing
| House | 2026 target | Implied vs $58 spot |
|---|---|---|
| JPMorgan | $60–65 rest-of-year band | +3% to +12% |
| Commerzbank | ~$67 | +16% |
| LBMA consensus | $79.57 | +37% |
| UBS | $80 year-end | +38% |
| Bank of America | $85.93 (2026 average) | +48% |
| Goldman Sachs | $85–100 | +47% to +72% |
| Citigroup | $110 (H2) | +90% |
Two things stand out from that table. First, after the deepest crash in the metal’s modern history, every major house’s target still sits above spot — even the most bearish desk on the street, JPMorgan, has $60 as its floor, roughly 3% above the July 30 price. Second, the gap between JPMorgan and Citigroup is nearly $50, which is not a forecasting disagreement so much as two different theories of what silver is: a rate-sensitive industrial input (JPM’s world) or a monetary metal due to close a 69:1 ratio against $4,050 gold (Citi’s world). Our own gold forecast is the other half of that ratio maths.
The deficit arithmetic deserves one more layer, because it is where the bull and bear cases actually collide. UBS’s revised balance assumes roughly 850 million ounces of mine supply for 2026 against investment demand it now models at 300 million ounces — down from the 400-million-plus pace it assumed before the crash — with photovoltaics and jewellery together shedding about 50 million ounces of demand, per Kitco. Run those numbers and the market is still short physical metal this year; what changed is the cushion. A 300-million-ounce deficit was a squeeze narrative; a 46-to-70-million-ounce deficit is merely a tight market, one that anchors price over quarters rather than driving it over weeks. That is why the same deficit headline can coexist with a 52% drawdown — and why the UBS desk’s actual trade recommendation was not a directional buy at all but harvesting option premium: “We view selling downside risk to harvest carry over the next three months as attractive,” Gordon and Schnider wrote. When the most constructive structural desk on the street is selling puts rather than buying futures, the institutional read is that $58 silver is cheap enough to underwrite, but not yet urgent enough to chase.
So is it a good time to buy after the fall?
The honest answer has two halves. The case for yes: the sixth consecutive supply deficit is still official (46.3Moz), the positioning flush is done by the open-interest evidence, every street target sits above spot, the fee-driven momentum sellers are out, and the gold-silver ratio at ~69:1 is at an extreme that has historically resolved by silver outperforming — with UBS noting that “we still expect gold prices to trend higher, providing an important anchor for silver.” A patient allocator buying weakness at $56–58 is buying below every bank’s base case with the July 16 low ($55.90) as a clean, close risk marker.
The case for no — or not yet: the crash’s cause has not gone away. The Fed’s July 29 vote structure leans hawkish, the photovoltaic demand contraction (~20% this year, per UBS) attacks the largest industrial demand line, ETF holders have withdrawn 70 million ounces, and JPMorgan’s silverless-solar warning is a real technology risk to the decade-long thesis, not a talking point. If the June-July pattern repeats at the September FOMC — sticky inflation, no cut, hawkish dots — the $55.90 low is unlikely to survive, and JPMorgan’s $60 band becomes a ceiling rather than a floor. Silver below the bear line is a momentum market, not a value market.
The FinanceFeeds call: base $72, bull $110, bear $60
Our base case has silver at $72 by December 31, 2026 — inside the Commerzbank-to-LBMA corridor — on the view that one Fed cut does arrive, PV destocking ends by Q4, and the official deficit keeps a floor under the physical market while the ratio grinds from 69 toward the low 60s. The bull case is Citigroup’s $110, which requires two things to break at once: a dovish Fed pivot (oil at $72 and cooling gives it room) and investment demand returning to the 400Moz-plus pace UBS assumed before its cut. The bear case is $60 — JPMorgan’s floor — on a hawkish September FOMC, with the July 16 low of $55.90 as the invalidation level below it: a weekly close under $55.90 would mark the first lower low since the crash and retire the basing thesis entirely.
What to watch, in order: the September FOMC dots; the Silver Institute’s interim demand data for photovoltaics; ETF flows turning from 70Moz of outflows to net accumulation; and the ratio — a decisive break back under 65 would be the earliest confirmation that the monetary bid has returned. The prior technical work on the $65.00 resistance level still marks the gate between a dead-cat bounce and a trend change.
FAQ
Why is silver falling in 2026?
Because 58% of silver demand is industrial and the Federal Reserve turned hawkish: the June FOMC cut its 2026 rate-cut projection from two to one on oil-driven inflation from the Hormuz conflict, hitting silver through the growth channel. Photovoltaic demand is down about 20% and ETF holders have withdrawn roughly 70 million ounces, per UBS.
Is silver a good investment after the crash?
At about $58, silver trades below every major bank’s 2026 target — JPMorgan’s $60–65 band is the street’s floor, Citigroup’s $110 the ceiling. The supply deficit is real (46.3Moz, sixth consecutive year) and positioning has been flushed, but the trade only works if the Fed eases. Size for the $55.90 invalidation level, not the headline targets.
What is the silver price prediction for end of 2026?
Our consolidated call: $72 base case by December 31, 2026, $110 bull case (Citigroup’s number, requiring a Fed pivot plus returning investment demand), $60 bear case (JPMorgan’s floor, on a hawkish September FOMC). A weekly close below $55.90 invalidates the basing thesis.
What does the 69:1 gold-silver ratio mean?
It takes about 69 ounces of silver to buy one ounce of gold — near the top of the 50-year range. Extremes this wide have historically resolved with silver outperforming gold, which is the core of the bull case; but the ratio can stay stretched while the Fed stays hawkish, so it is a valuation anchor, not a timing tool.
Will silver go back to $100?
Only Citigroup ($110) and the top of Goldman Sachs’ range ($100) still carry three-figure targets, and both require a dovish Fed pivot plus investment demand returning near 400 million ounces. That is a 2027 question more than a 2026 one unless September delivers a surprise cut — the January record was a positioning spike, not a sustainable clearing price.
Why didn’t silver rise during the war?
The war’s lasting market effect was inflationary oil, which made the Fed more hawkish — and rate-sensitive industrial demand, not fear, sets silver’s marginal price. Gold absorbed the safe-haven flow (holding above $4,050) while silver traded as what it functionally is: an industrial input facing a slower economy.
This article is informational analysis only and is not financial or investment advice. Commodity prices are volatile and can lose substantial value rapidly. Past performance and historical patterns do not guarantee future results. Do your own research and consult a regulated financial adviser before making any investment decision.